- Industry: Social Media
- GitHub Link: https://github.com/PoornimaKanasen/Accenture_Virtual_Internship
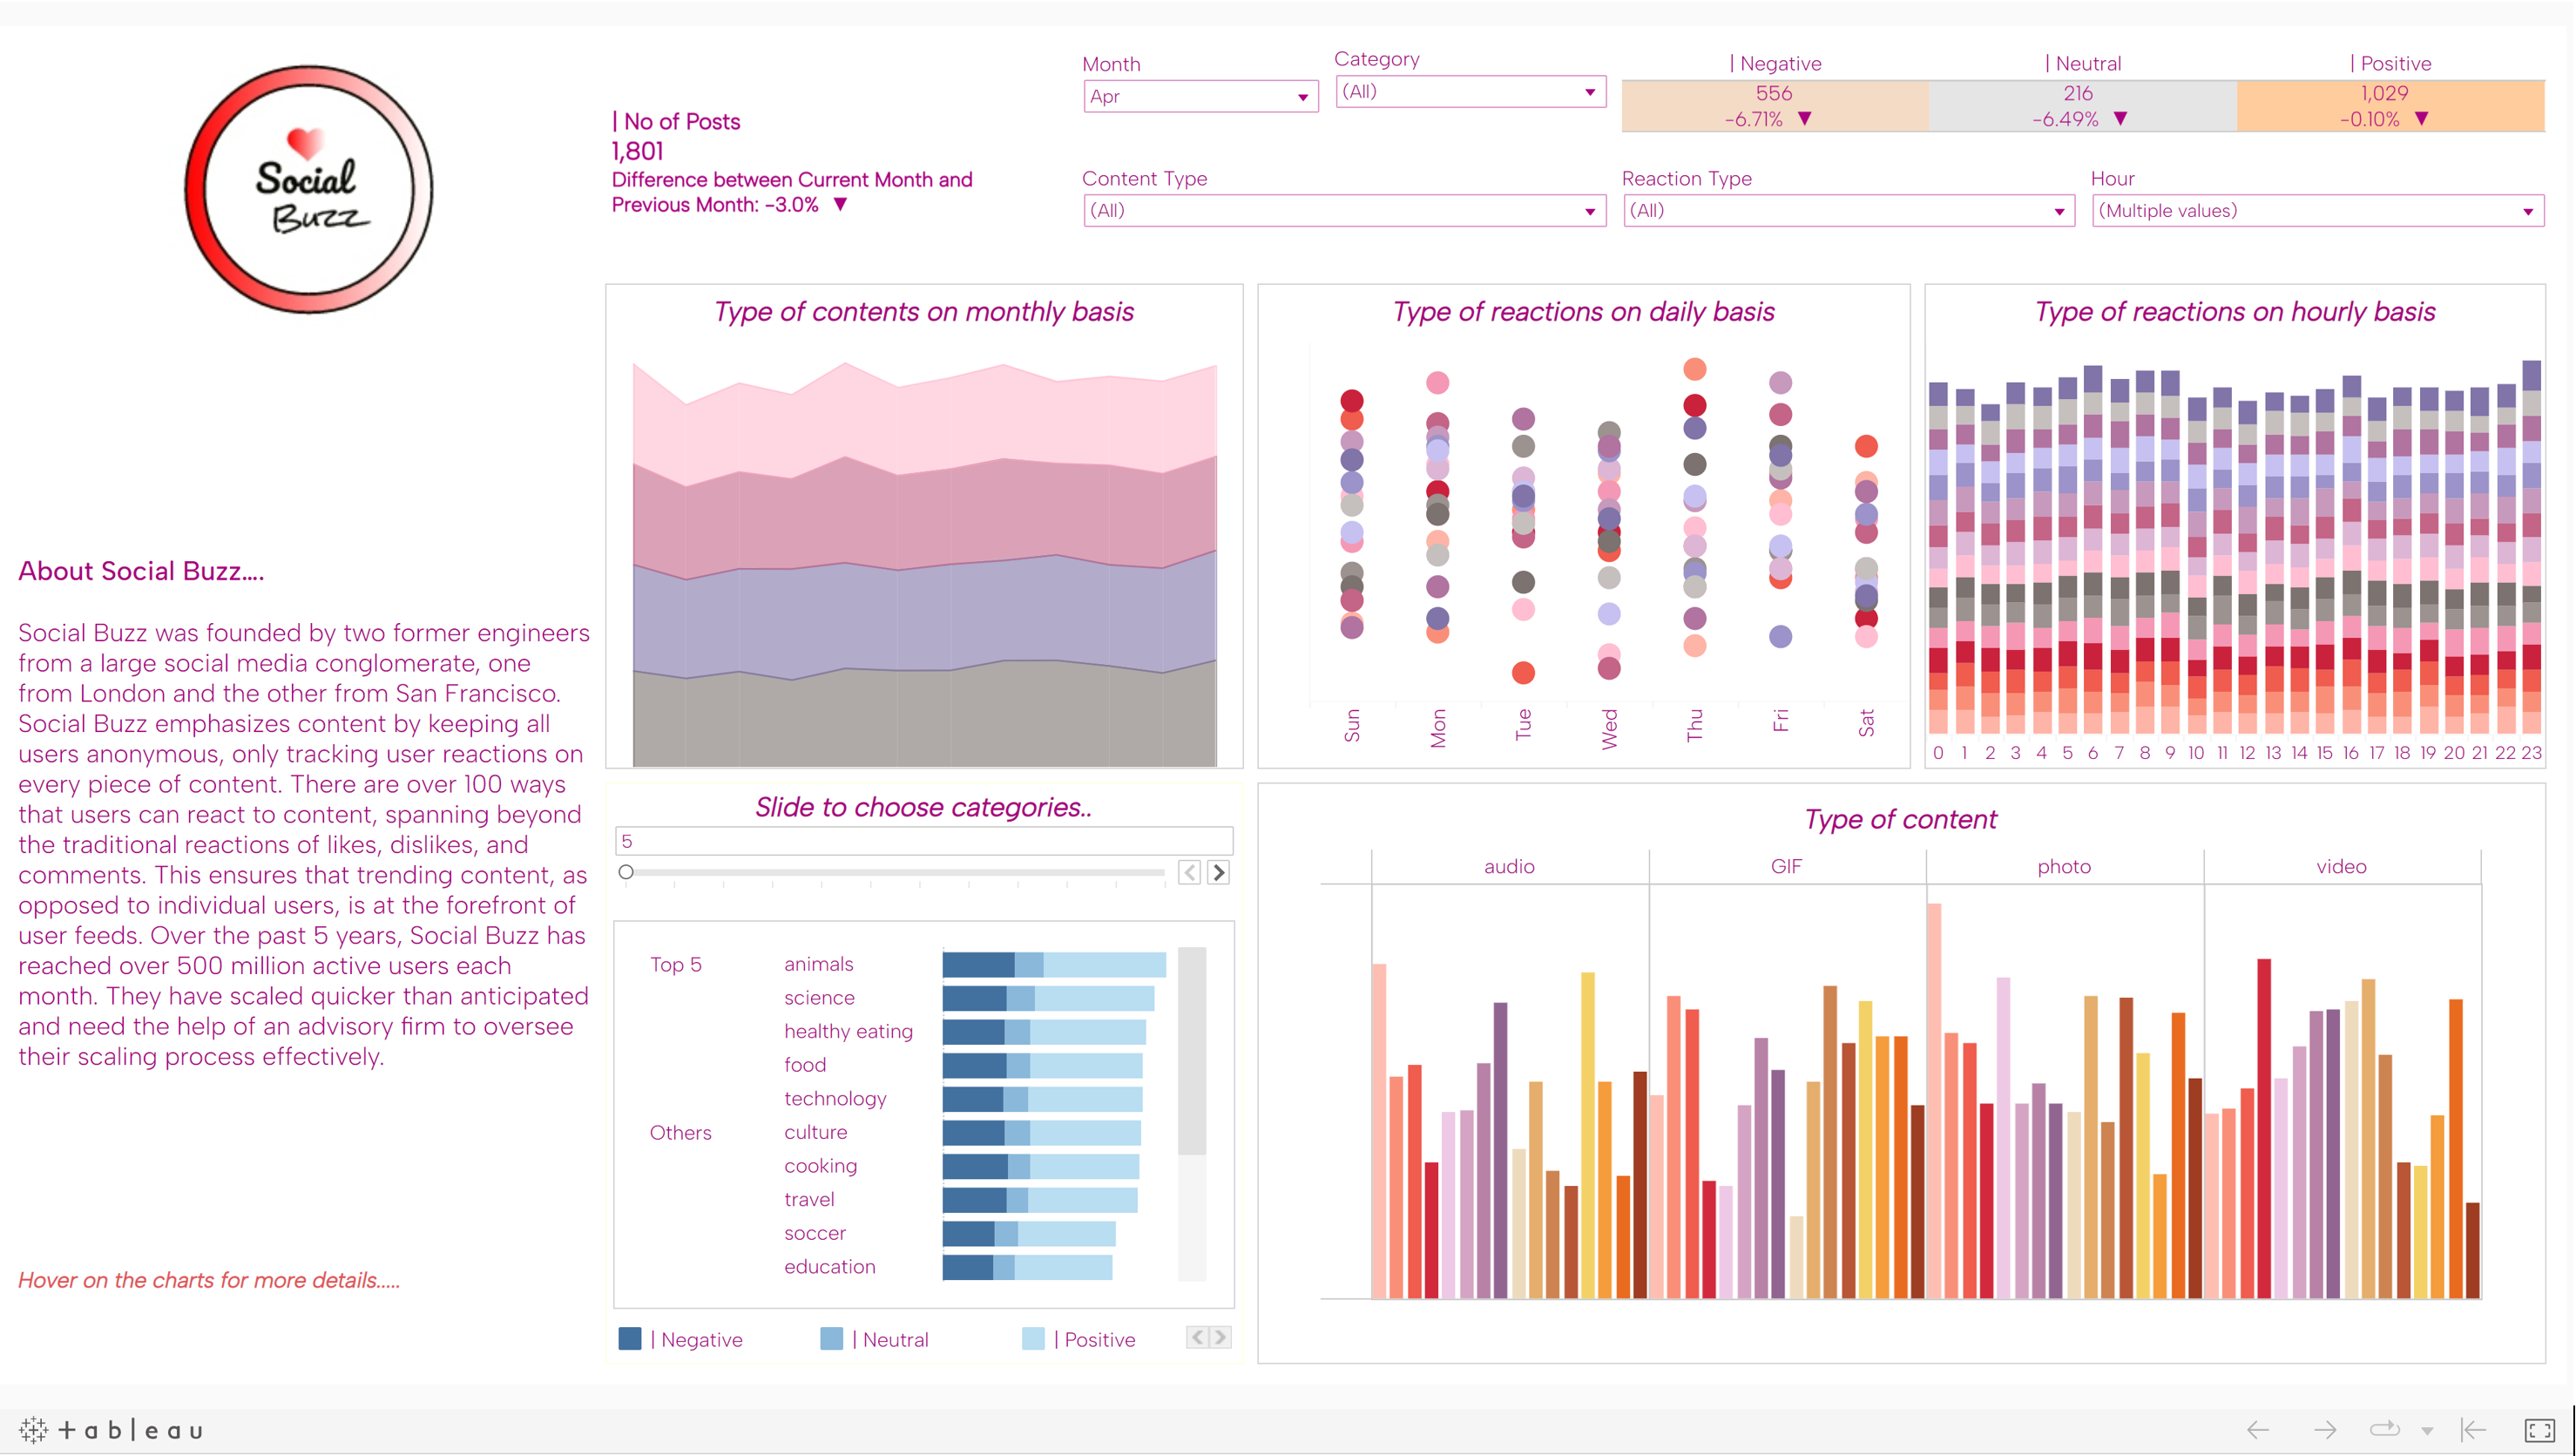
- Tableau Link: https://public.tableau.com/app/profile/poornima.kanasen/viz/SocialBuzz-Dashboard/Dashboard1?publish=yes
Objective
To understand the data distributions, feature engineering, data transformations, modelling, results interpretation and reporting.
Completed tasks
- • Project Understanding
- • Data Exploration, Model Development and Interpretation
- • Data Visualization and Storytelling
Analysis
EDA, or exploratory data analysis, is a crucial step in the data analysis process. It involves examining and visualizing the data to gain a deeper understanding of its characteristics, patterns, and relationships.
- • Identifying patterns and trends: EDA allows you to identify patterns and trends in the data that may not be immediately obvious. By visualizing the data in different ways, you can uncover relationships and correlations that you might have otherwise missed.
- • Detecting outliers and anomalies: EDA can help you identify outliers and anomalies in the data. These are data points that are significantly different from the others and may require further investigation.
- • Checking data quality: EDA allows you to check the quality of the data. You can look for missing values, inconsistencies, and other issues that may affect the analysis.
- • Choosing appropriate statistical models: EDA can help you choose the appropriate statistical models for your analysis. By understanding the characteristics of the data, you can choose models that are best suited to the data.
- • Communicating results: EDA can help you communicate the results of your analysis effectively. By creating visualizations and summaries of the data, you can convey complex information in a way that is easy to understand.
Tools used
Python, Pandas, Numpy, Matplotlib, Seaborn, Tableau
Insights
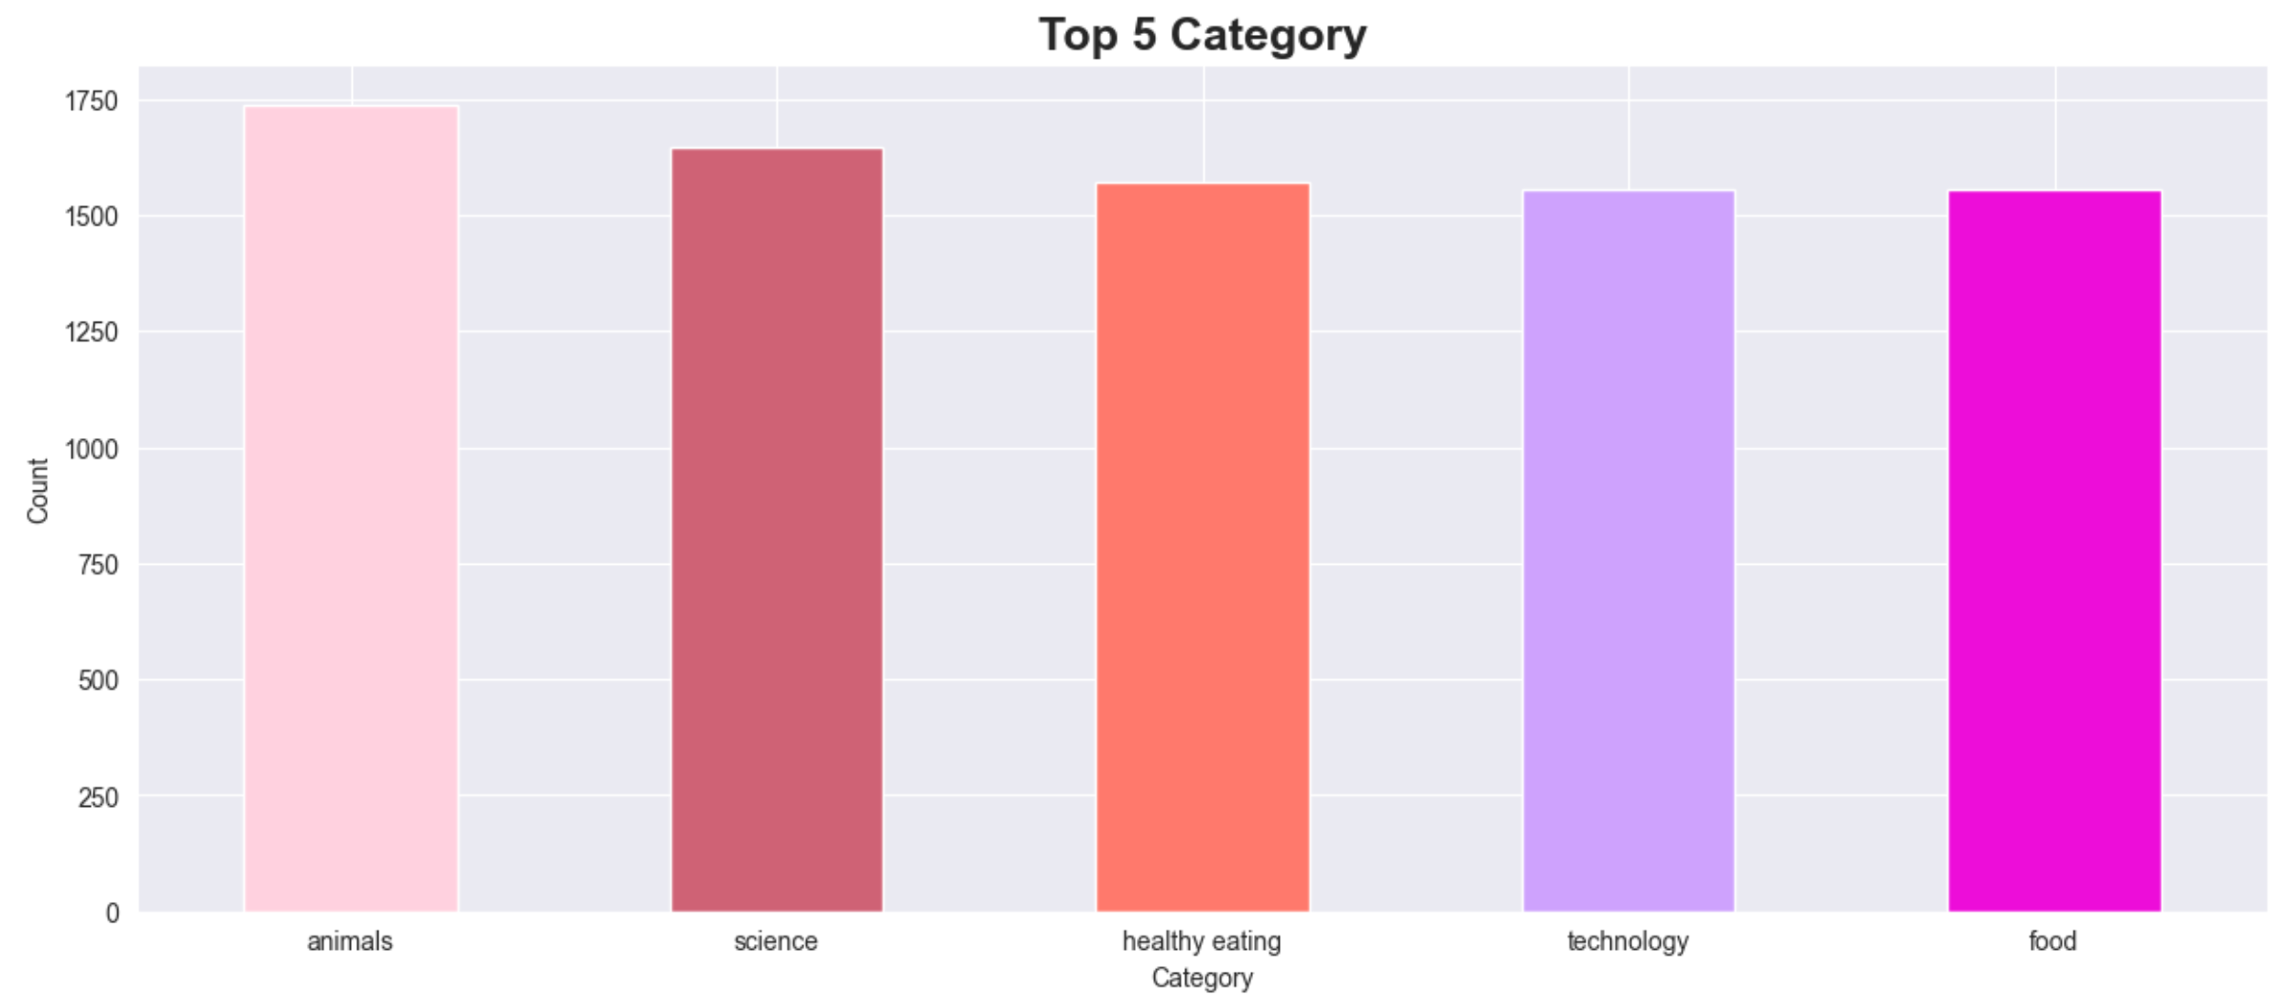
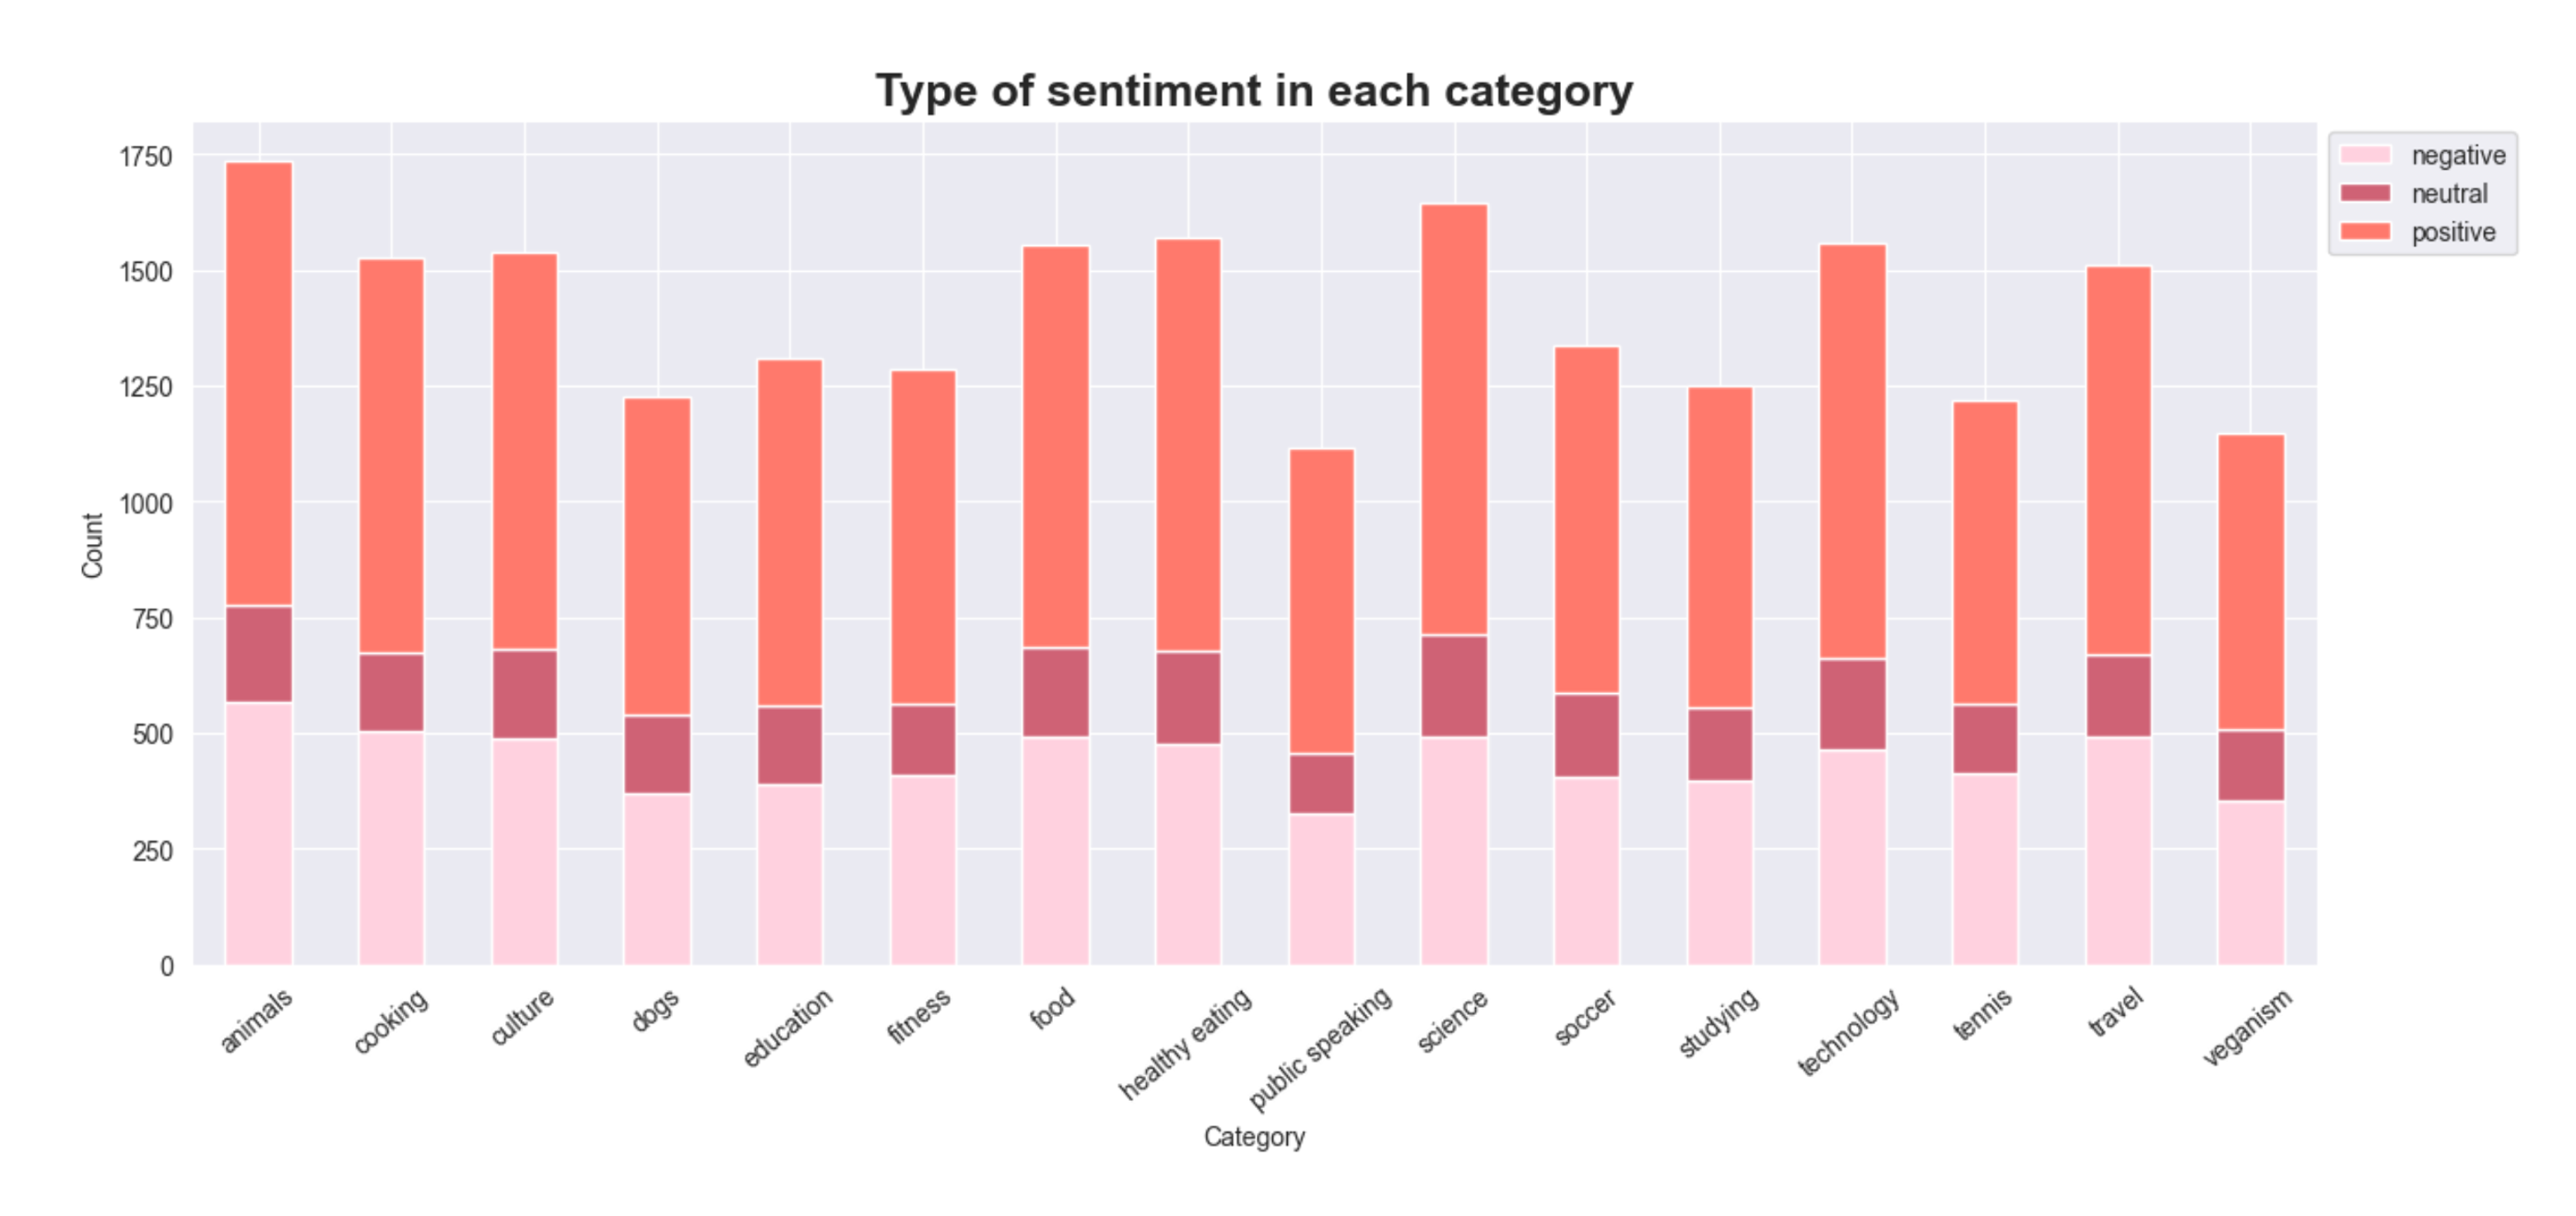
- • the top five most frequented categories are animals, science, healthy eating, technology and food in descending order.
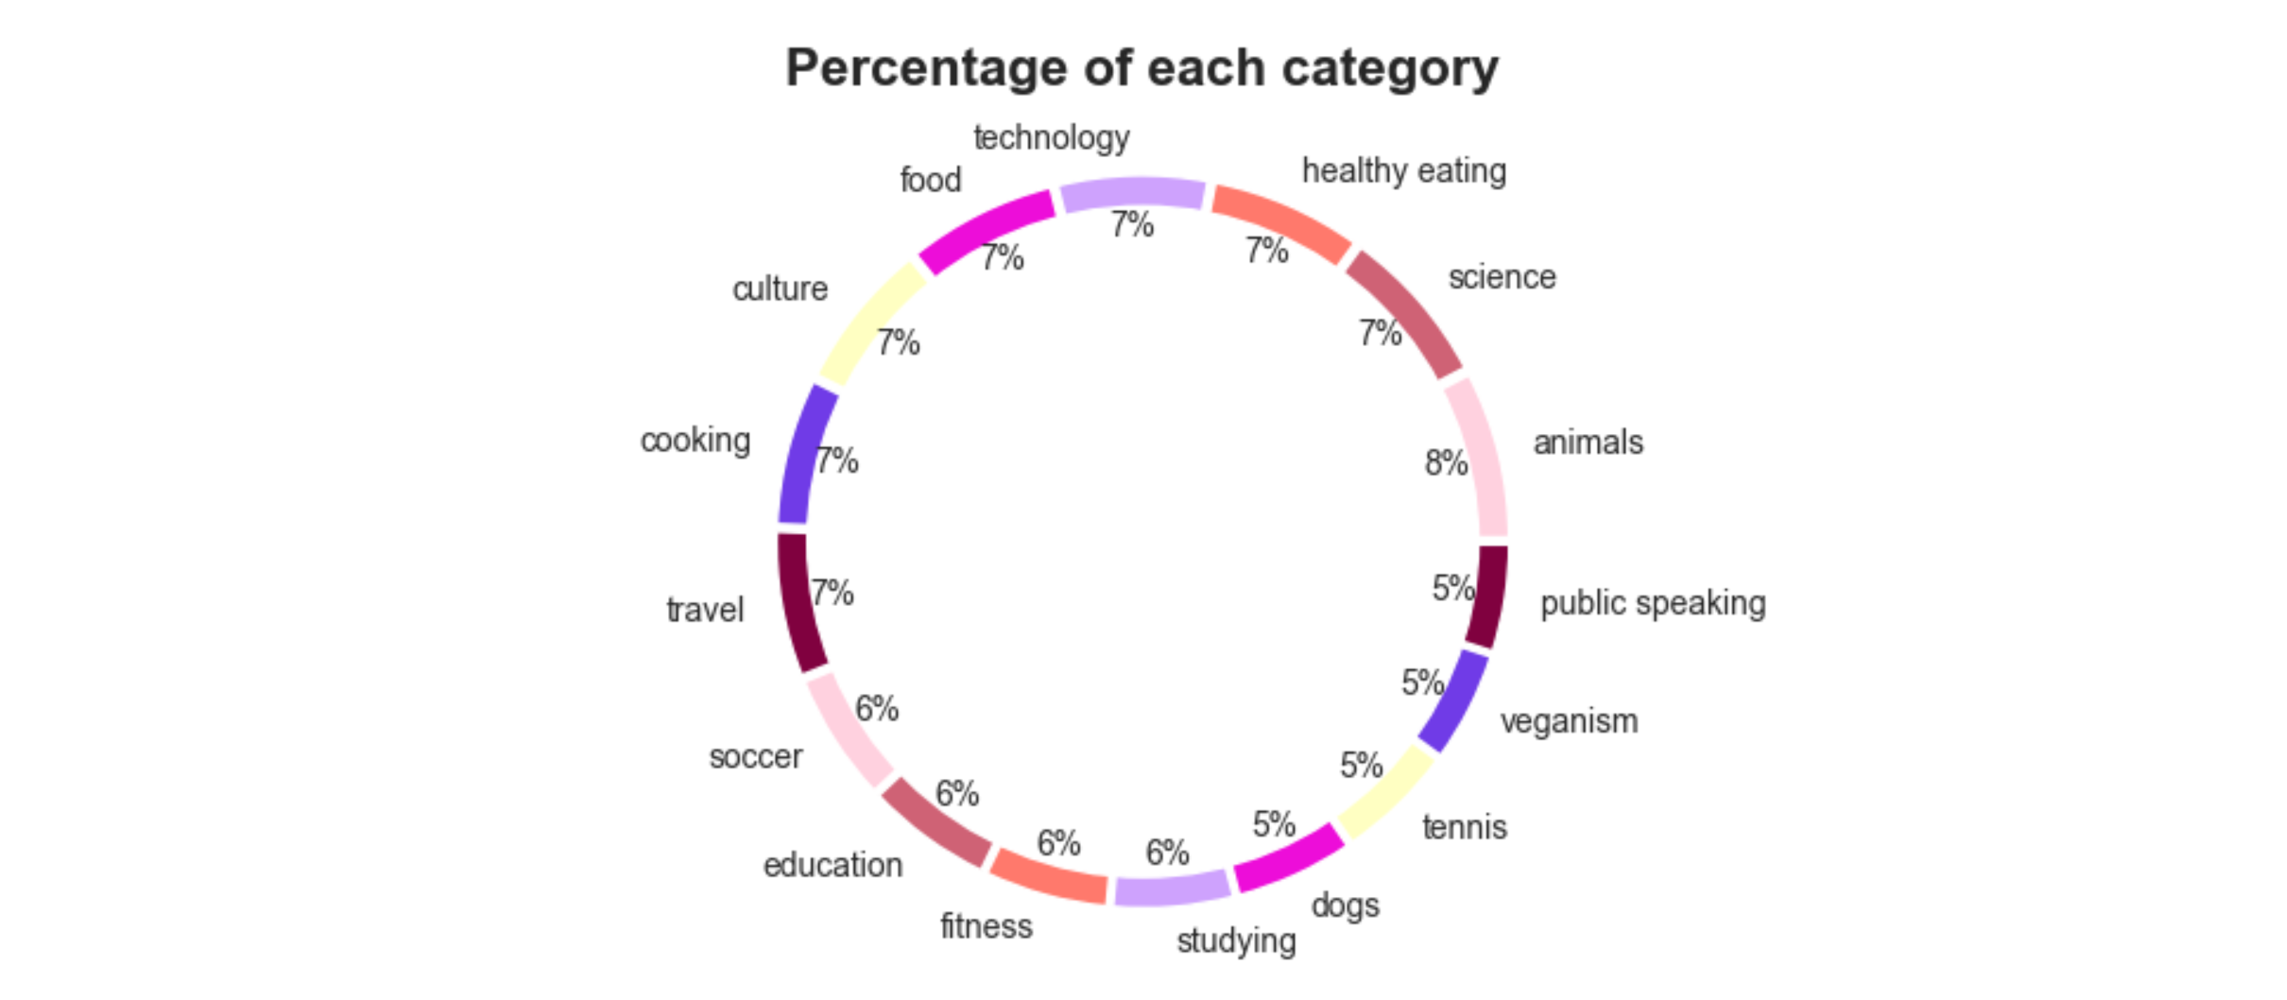
- • animal category has the highest percentage which is 8 % followed by the rest with 7 percentages each in the top five list.
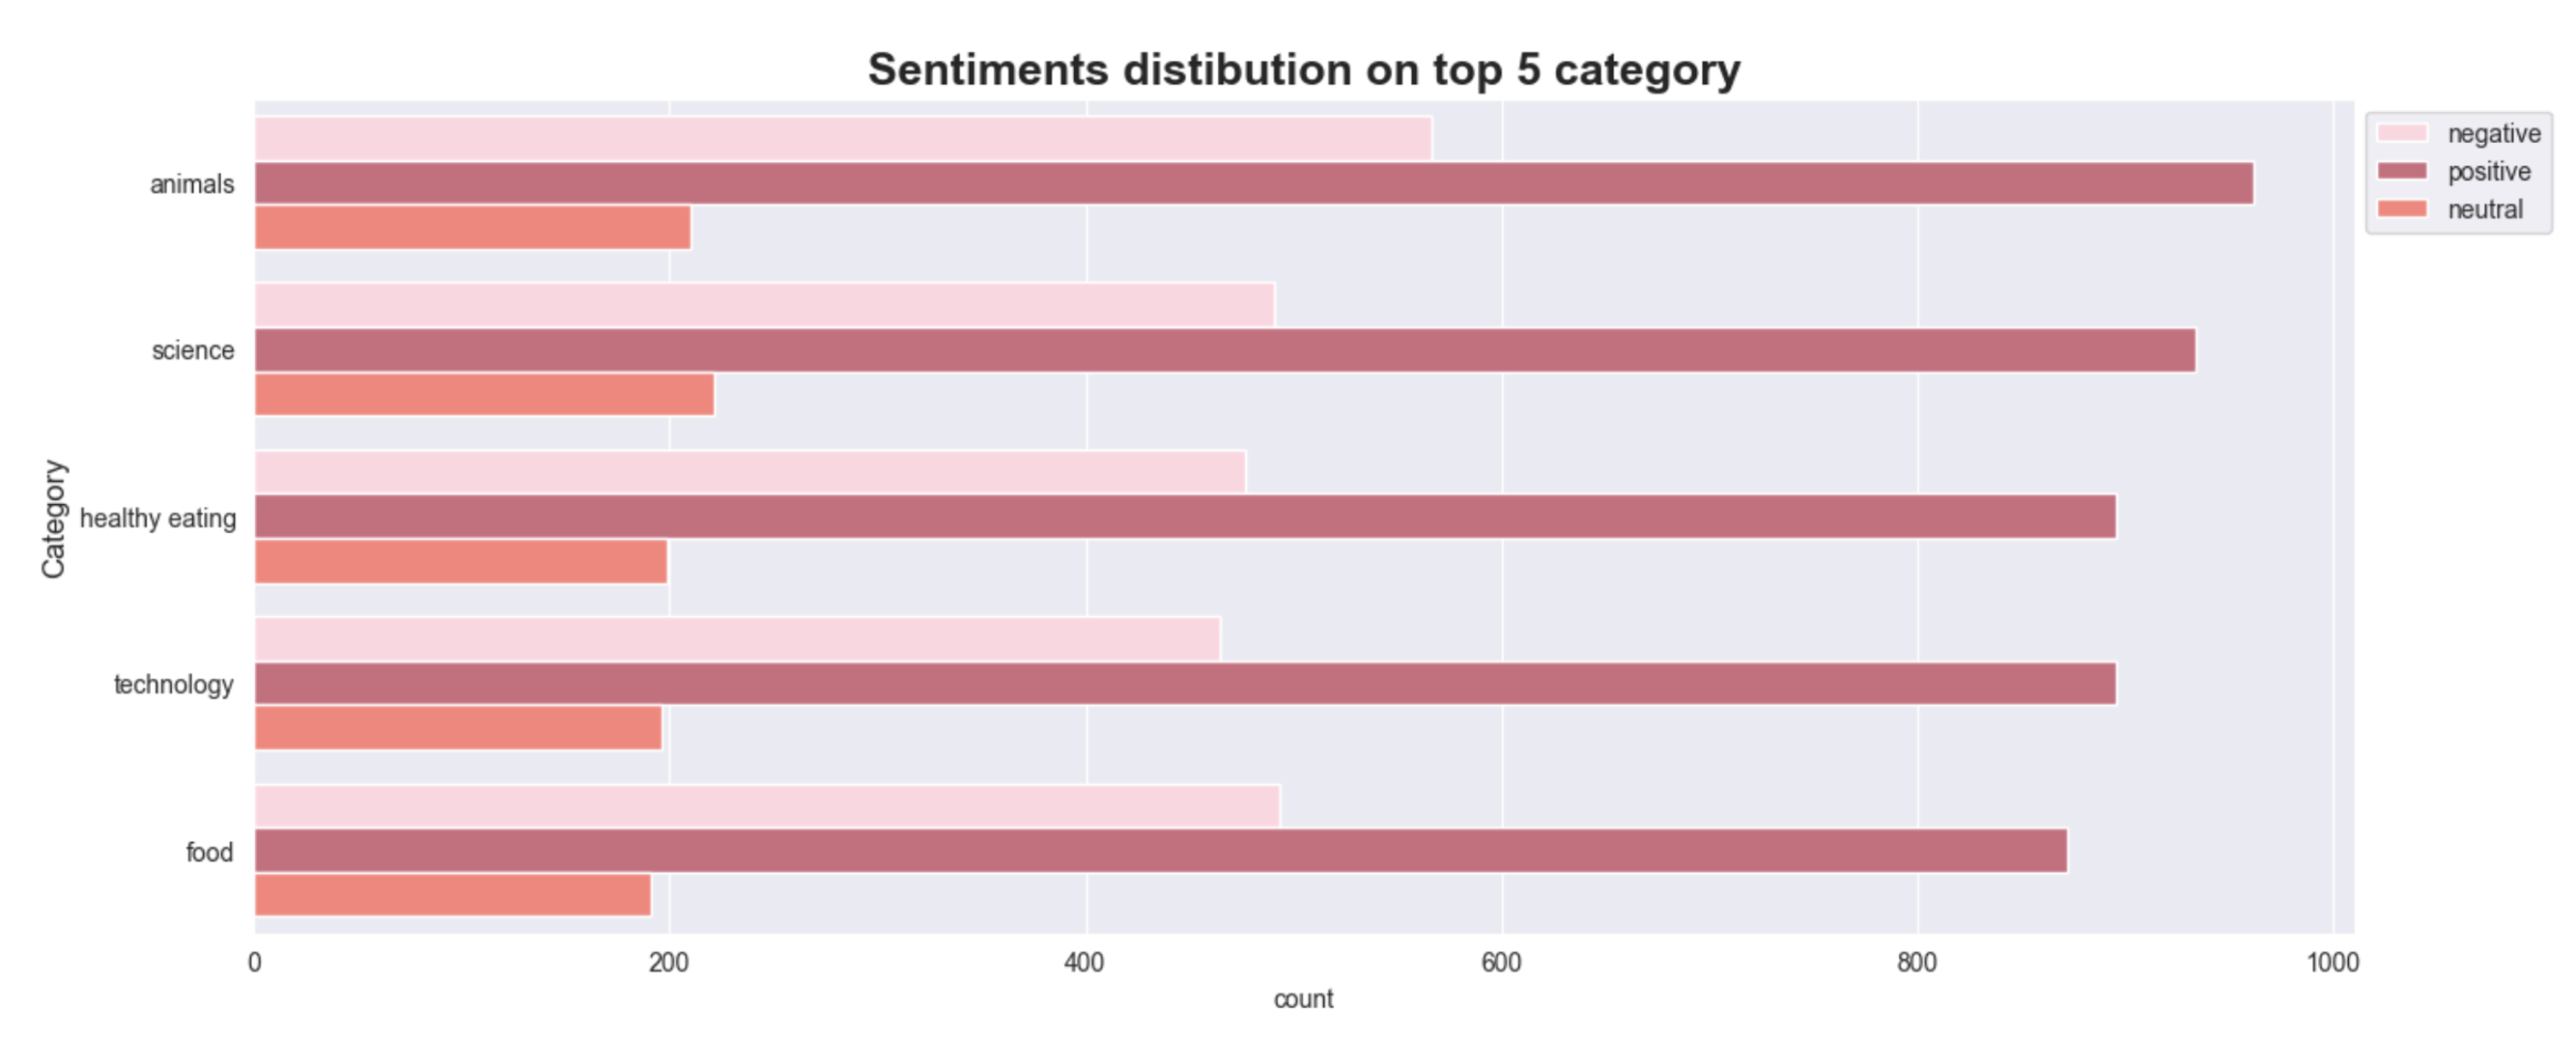
- • Most of the categories received more positive feedback, followed by negative and then neutral.
- • There are four type of content which are photo, video, GIF, audio.
- • Generally, there are more positive feedbacks in total
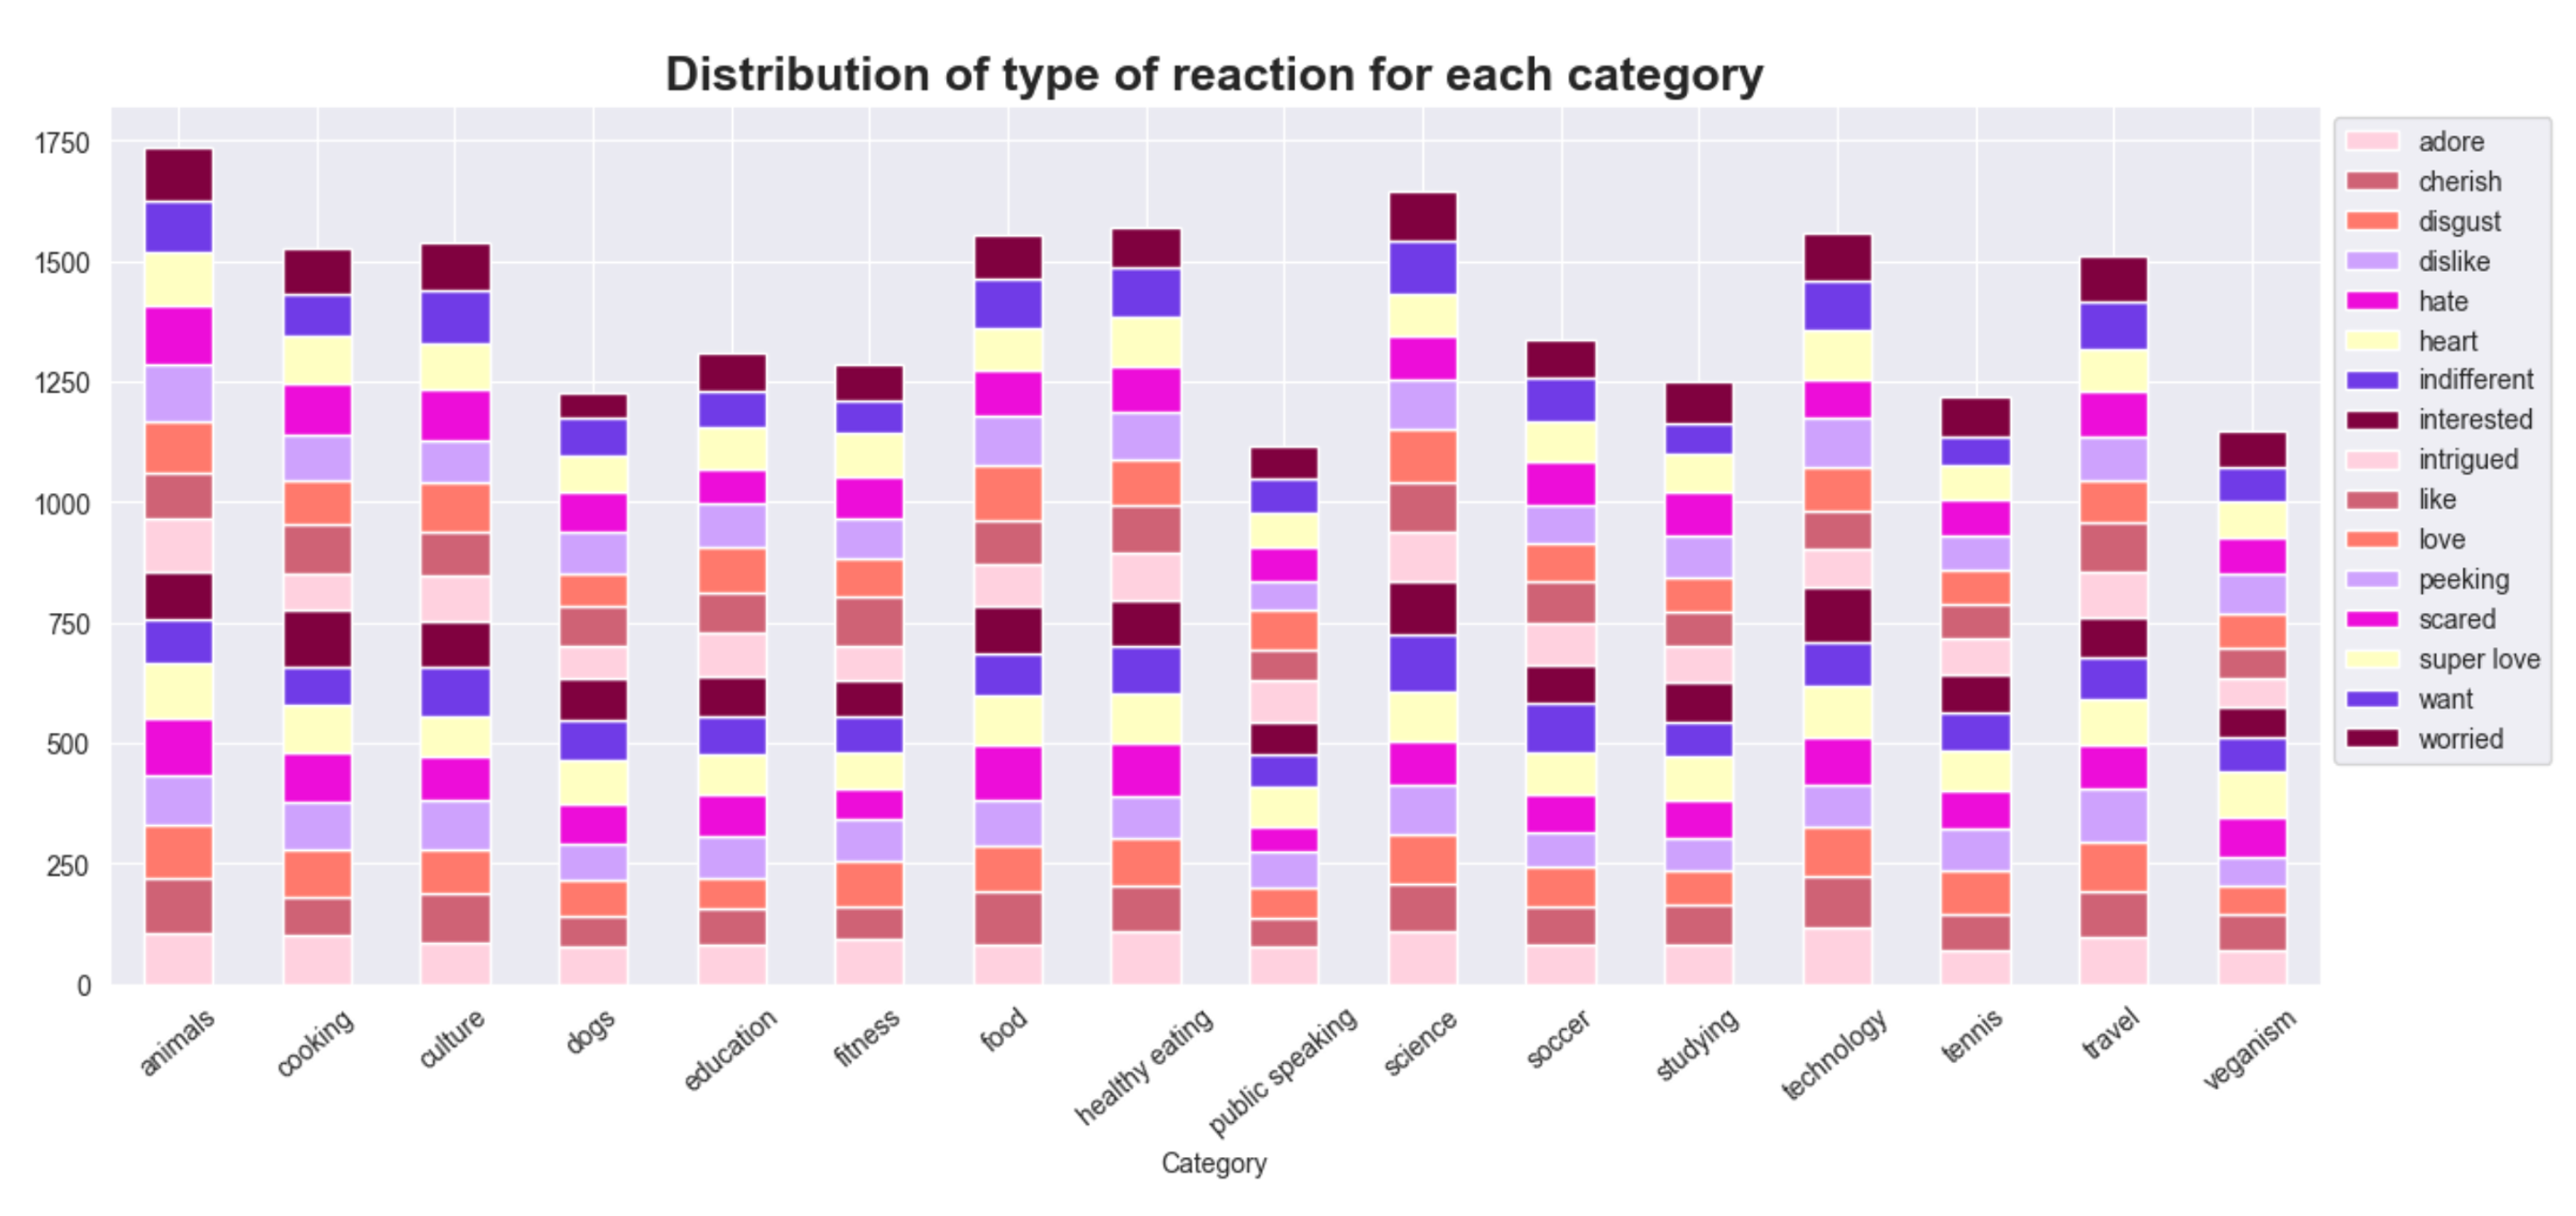
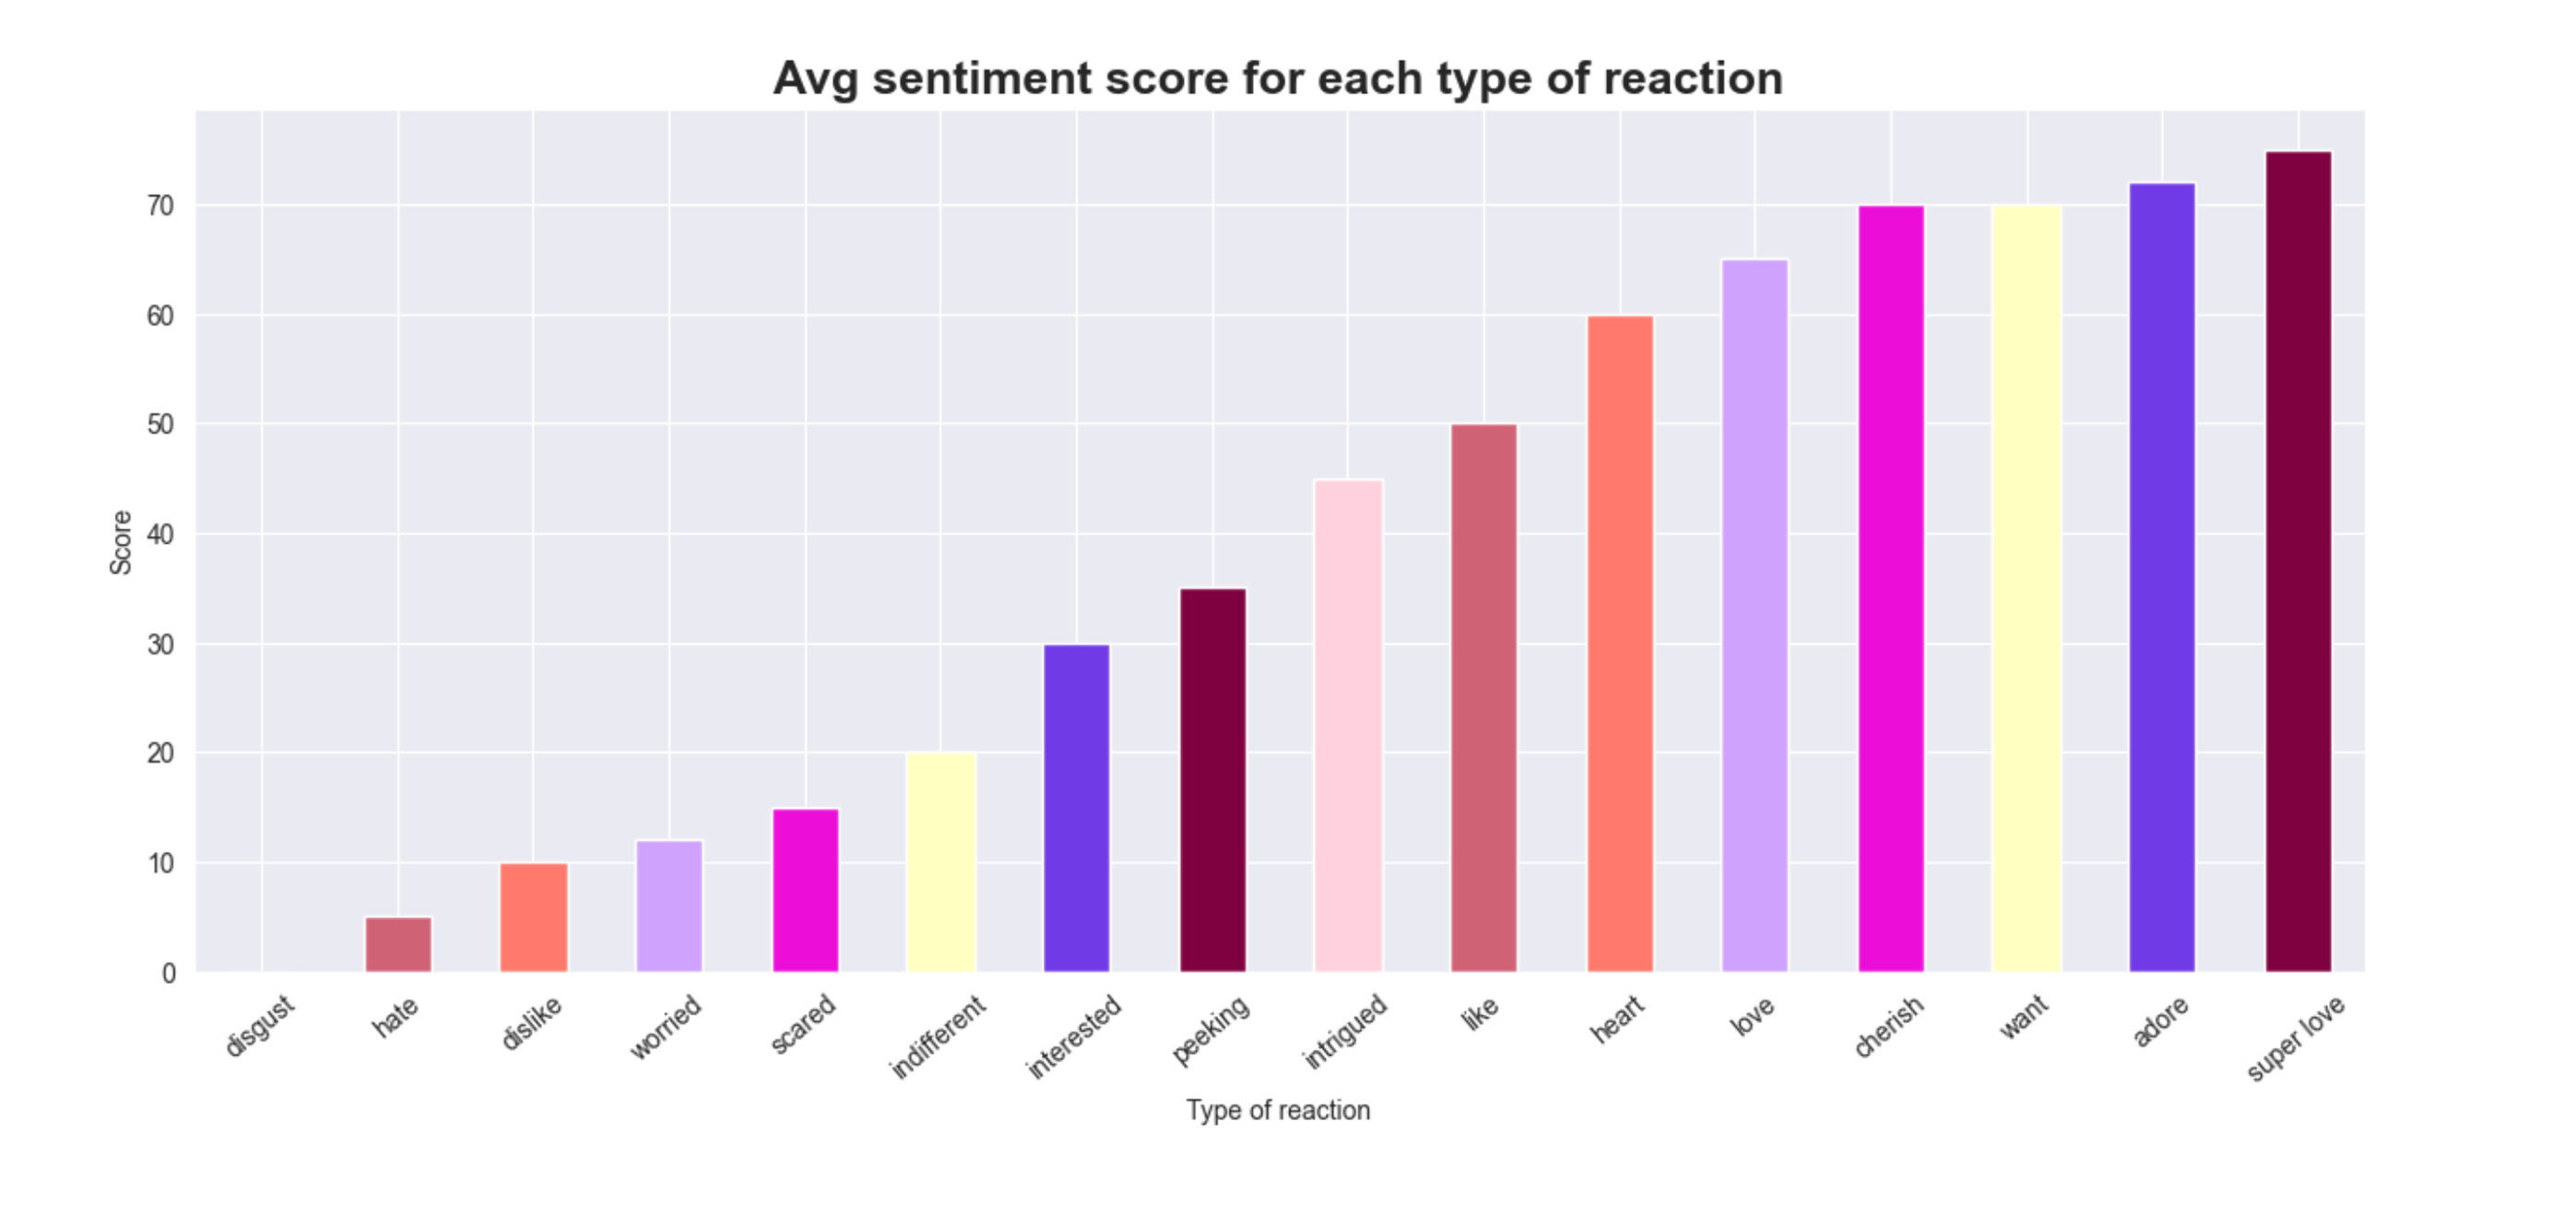
- • Highest average score is for super love reaction, and the lowest is disgust.
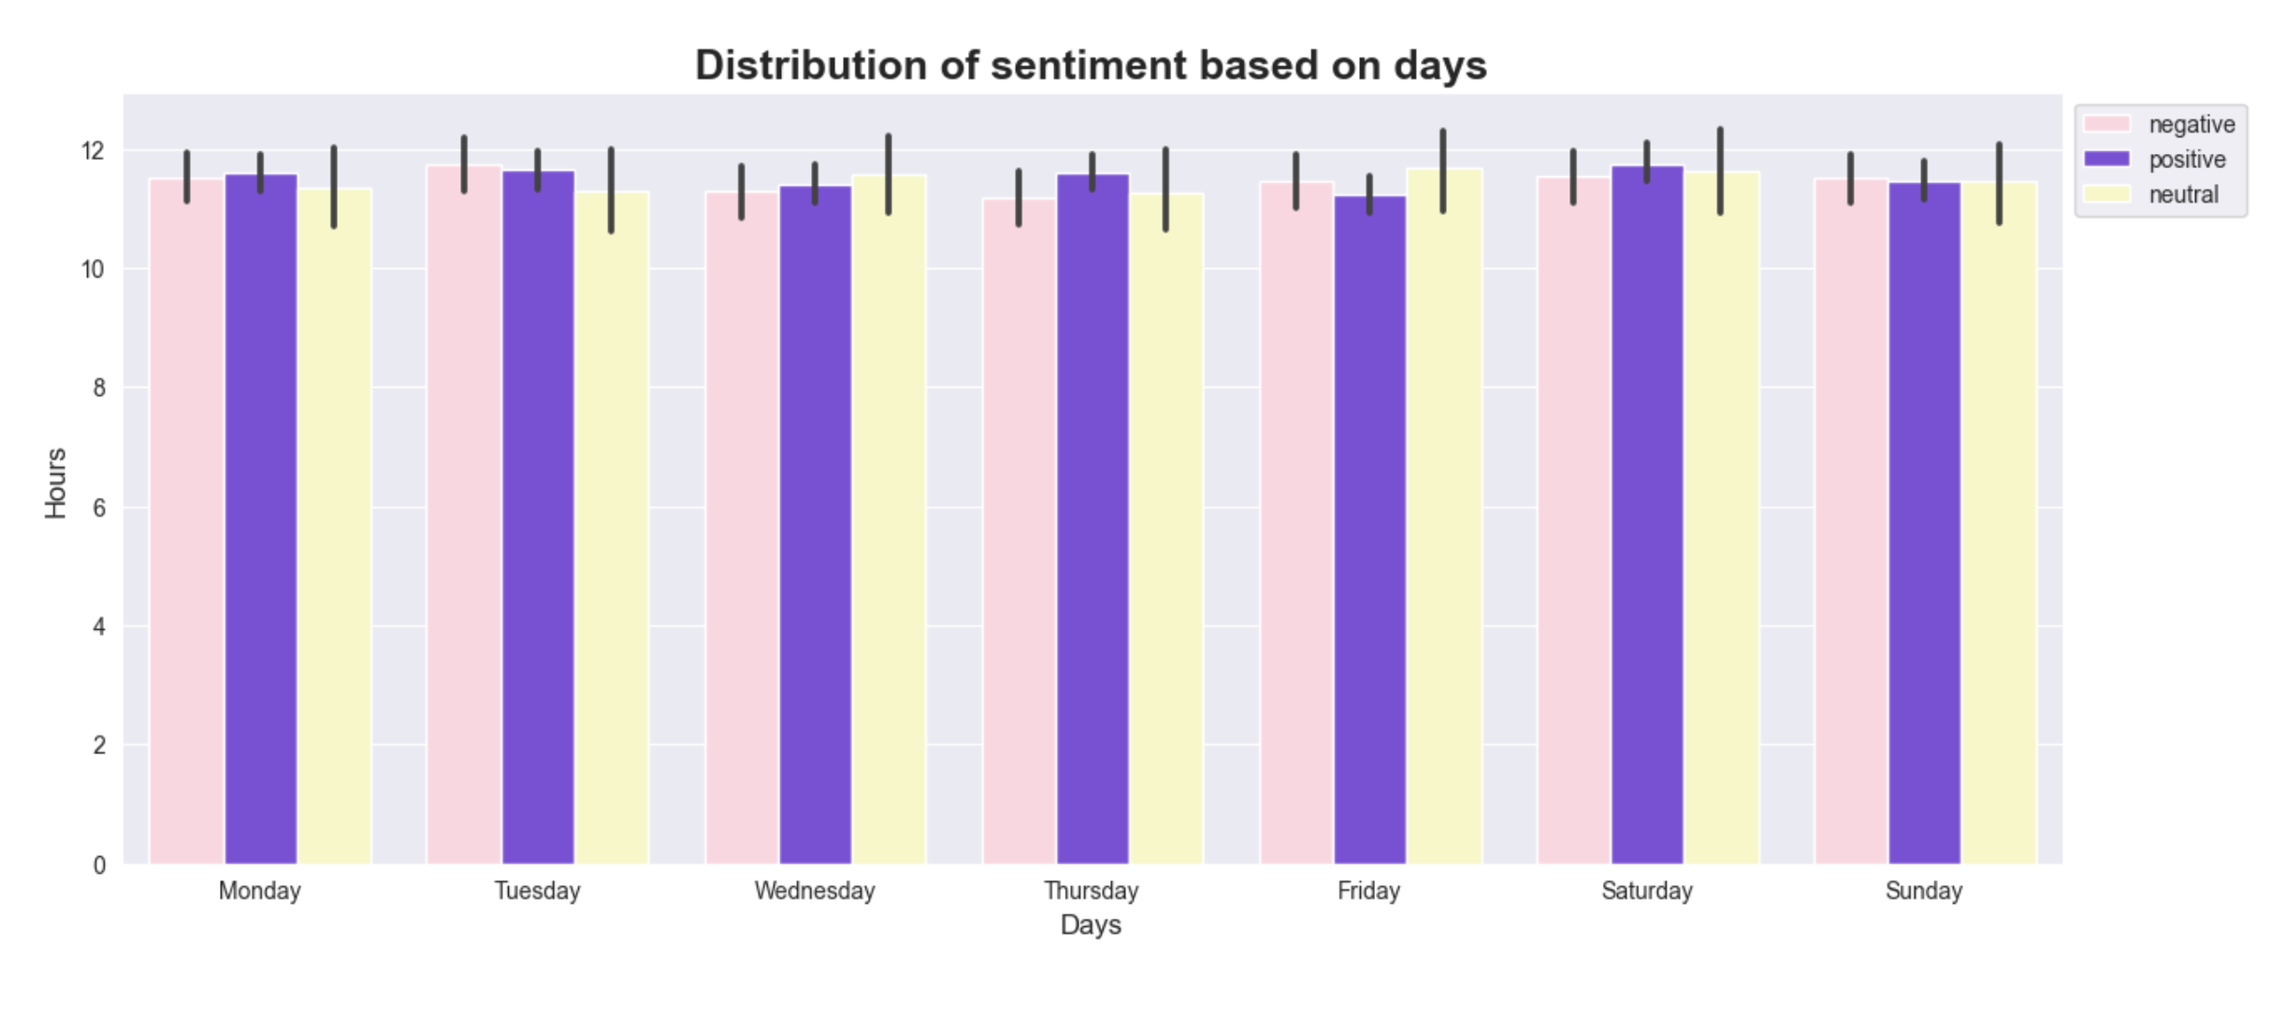
- • The type of sentiments (positive, neutral and negative) are similar every day, regardless of weekdays or weekends.
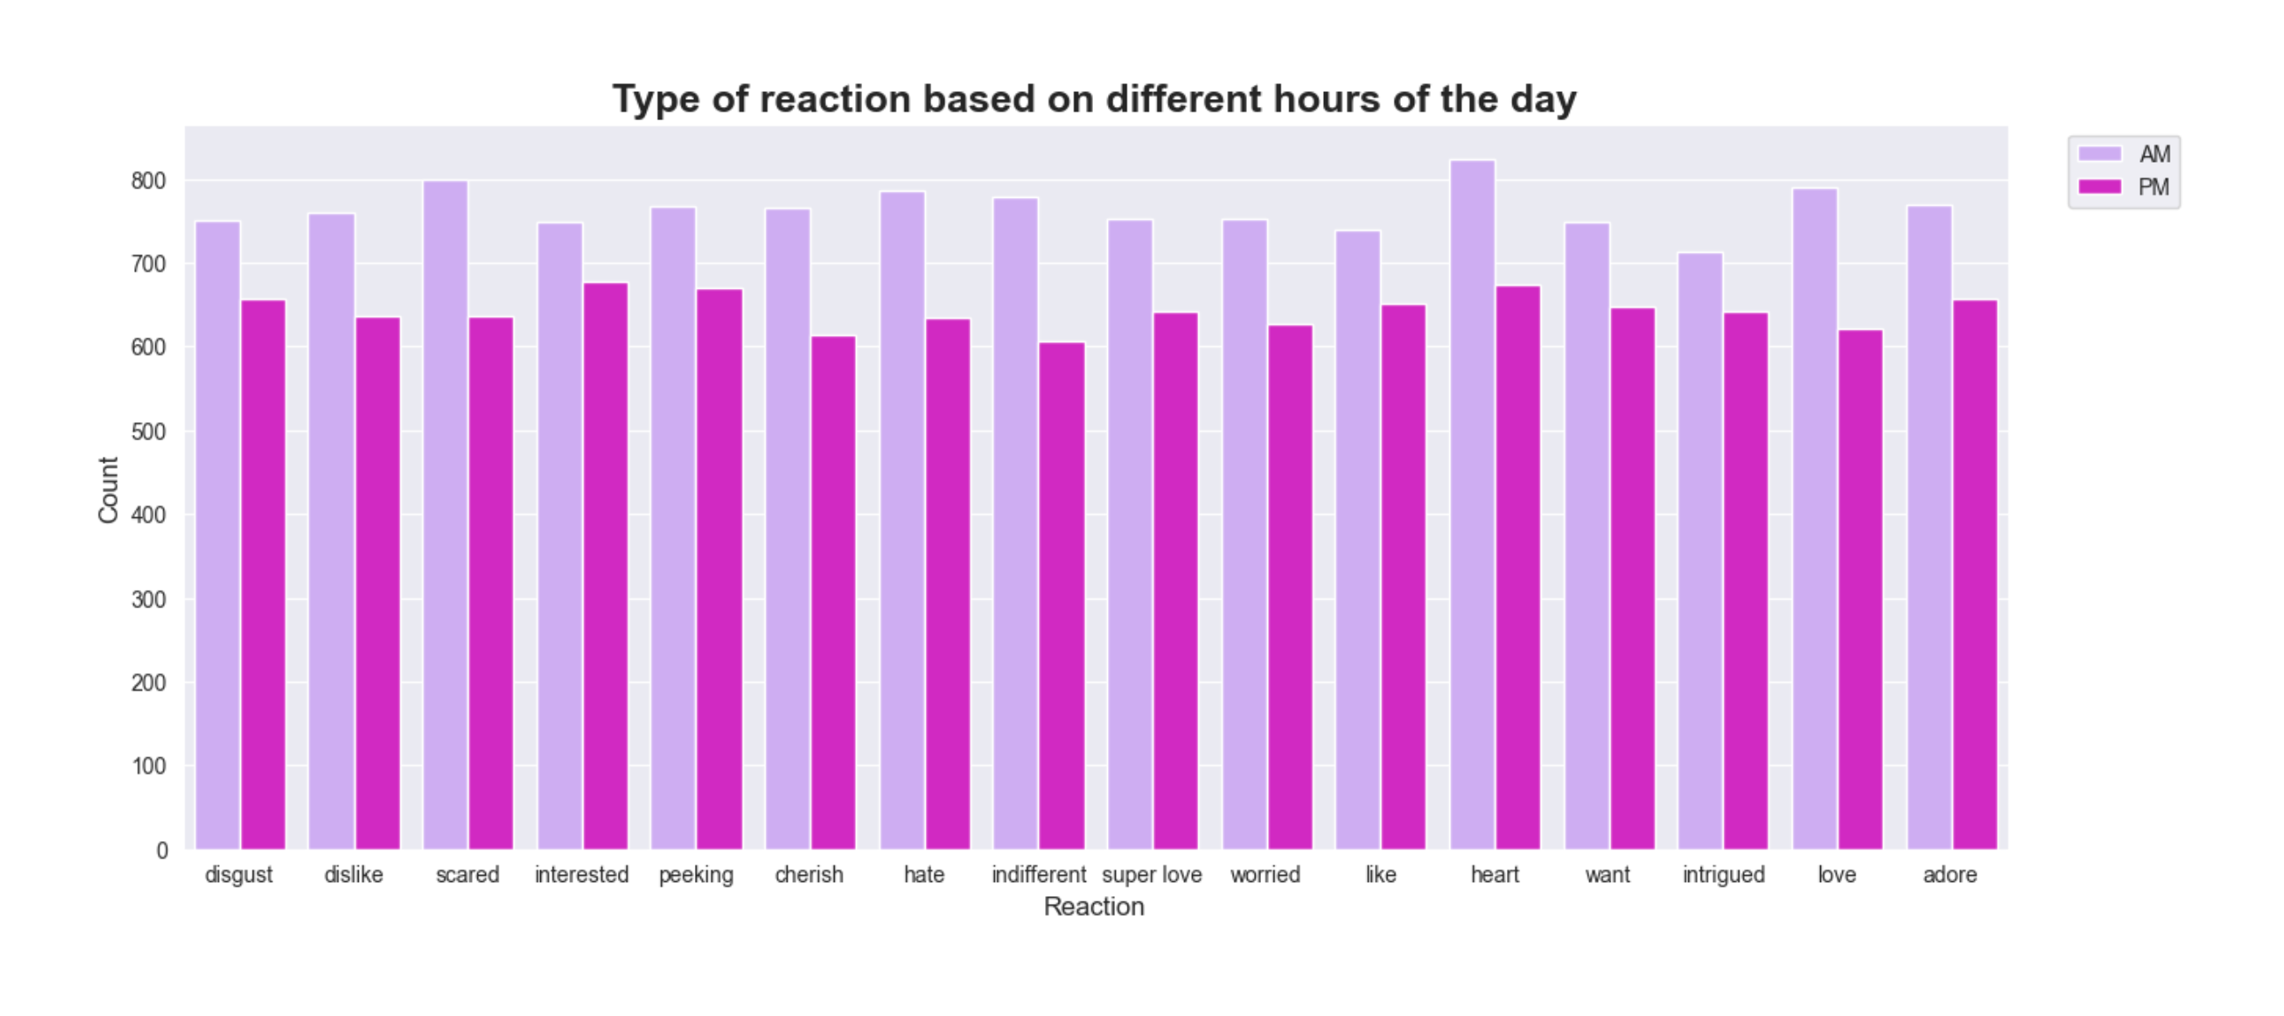
- • On average, users tend to engage more in the morning compared to evening/night.
Visuals from Python-Jupyter Notebook-Pandas-Matplotlib-Seaborn